Most people don’t know this, but simply running A/B tests can actually hurt your business. Surprised? It’s true. Testing without understanding the right metrics to track is like trying to win a race with no idea where the finish line is. You might feel like you’re moving forward, but you’re likely wasting time, energy, and resources—and worse, missing the insights that actually matter.
A/B testing is one of the most powerful tools in modern marketing. Done right, it’s how brands like Netflix, Amazon, and even small startups fine-tune their user experiences, boost conversions, and make data-driven decisions. But if you’re focused on the wrong metrics, you’re not just spinning your wheels; you’re potentially steering in the wrong direction.
For example, when Barack Obama’s campaign team ran an A/B test on their donation page, they increased donations by $60 million. Yes, you read that right—$60 million! They didn’t redesign their entire website or launch a costly ad campaign; they simply tested different variations of their page.
If A/B testing can do that for a presidential campaign, imagine what it can do for your business.
But before we jump into these important metrics in A/B testing, let’s answer one vital question.
What is A/B testing?
Did you ever, as a kid, have those amazing weekends when your mom would bake cookies, and she’d let you be her little taste-tester? Imagine she’s trying to decide between two slightly different chocolate chip cookie recipes. One uses brown sugar, the other white sugar, but everything else is exactly the same.
She bakes a batch of each and gives them to different groups of your friends at a playdate. Without telling them which is which, she watches to see which cookies get eaten faster, which ones get the most “mmm!” reactions, and which plate kids keep coming back to.
That’s essentially A/B testing!
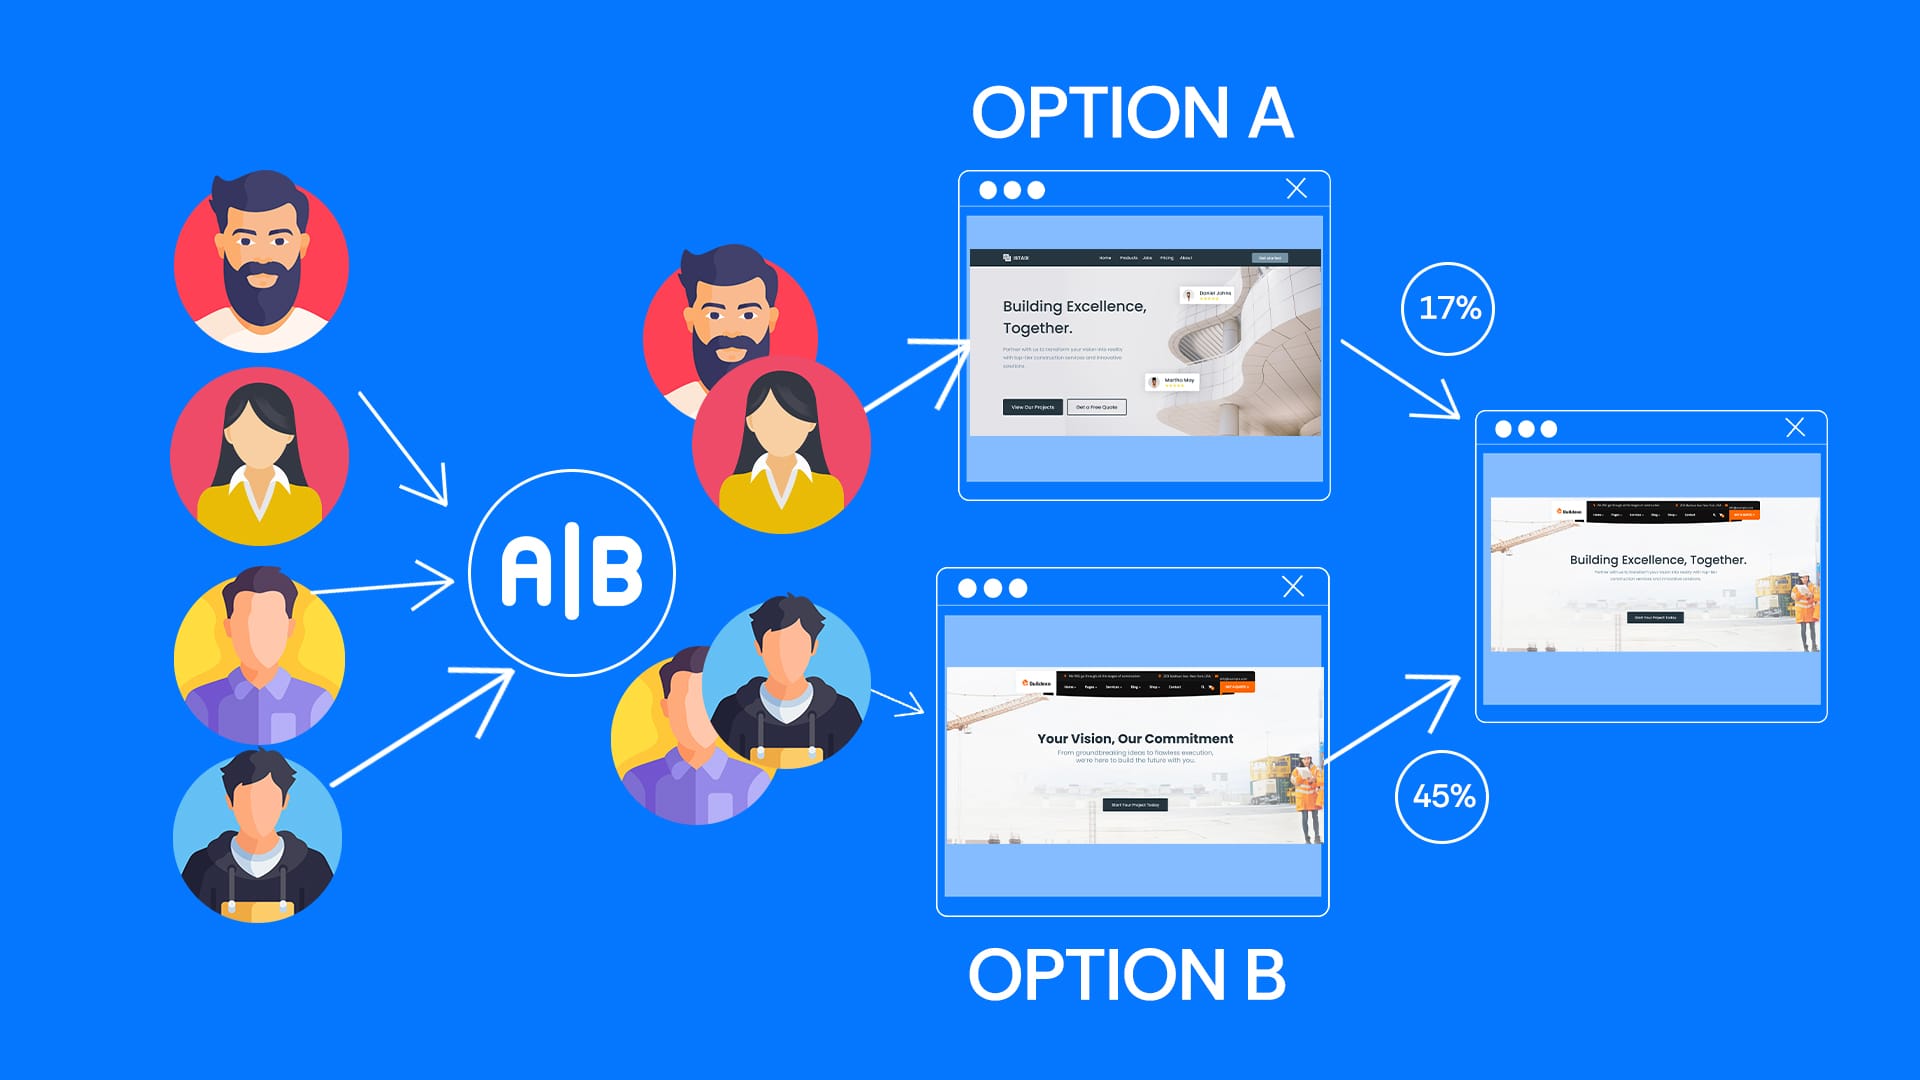
To simply put, A/B testing is a data-driven method of comparing two versions of something—like a webpage, email, or ad—to see which one performs better. Then, you measure the data to see which version gets better results.
It’s that simple.
For example, let’s say you want to test your call-to-action button. You could create two versions:
Version A: A blue “Sign Up Now” button
Version B: A red “Get Started Today” button
Then you observe. Which of them attracts the most clicks? Does it have something to do with the colours or is it the copy? That’s the beauty of A/B testing. And the best part? You’re not relying on opinions or guesses—just cold, hard data of what resonates more with your audience.
Renowned entrepreneur, Dan Siroker expertly puts it this way: “A mistake that some companies make is to start moving a bunch of levers around without clear planning upfront for what they’re trying to optimize—and what will be impacted by those changes.”
Now that we have this out of the way, let’s look into the 5 most important metrics to track when it comes to A/B testing.
1. Conversion rate
Let’s start with the most obvious one—Conversion rate. It’s the metric that tells you how many of your website visitors are taking the action you want—whether that’s making a purchase, signing up for a newsletter, booking a demo, or downloading an app. At first glance, it seems simple: higher conversions mean success, right?
Sadly, it’s one metric everyone talks about but do not always get right.
When Bing tested different shades of blue for their hyperlink color, they increased their revenue by $80 million annually. That’s the power of conversion optimization.
The formula is straightforward:
Conversion rate = (Number of conversions ÷ Total visitors) × 100
But here’s where people get it wrong: they stop at the conversion number. They don’t ask why one version worked better—or whether it’s sustainable. A/B testing isn’t just about short-term boosts; it’s about understanding how users interact with your site. And as you’ll see as we progress in this article, you need to really dig deeper.
2. Bounce rate
Bounce rate measures the percentage of visitors who leave your site after viewing only one page—no clicks, no scrolling, no action.
Imagine you’ve just launched a landing page. It’s sleek, minimalistic, and visually stunning. You’re excited to see your effort yield results, but then you notice something alarming—users are leaving almost as soon as they arrive. What’s going on? That’s where bounce rate comes in. A high bounce rate can indicate issues with your design, content, CTA buttons, or even page load time.
For example, when an e-commerce store notices that one product page has a much higher bounce rate than another, it’s often a sign that something’s off. Maybe the page loads too slowly. Maybe the messaging doesn’t match the ad that brought users there. Or maybe it’s just plain confusing.
The formula:
Bounce rate = (Single-page sessions ÷ Total sessions) × 100
Here’s a pro tip: If your bounce rate is high, start by checking your page load time. Studies show that every extra second of load time reduces conversions by 7%. Even giants like Amazon obsess over milliseconds because they know how quickly users lose patience.
3. Average session duration
Have you ever binge-watched a Netflix show and realized hours had passed? That’s the level of engagement every website dreams of. While you probably don’t need users spending hours on your site, you do want them to stick around long enough to engage with your content. That’s where average session duration comes in.
This metric tells you how much time users spend on your site during a single visit. Because higher session durations often correlate with better user experiences—and higher chances of conversion.
For instance, The New York Times once ran A/B tests on their homepage layout. They experimented with how articles were presented—headlines, images, and summaries. By increasing session duration by just 10%, they saw a 20% boost in subscription conversions. Why? Because when users stick around longer, they’re more likely to engage and follow through.
The formula:
Average session duration = Total session duration ÷ Total sessions
Want to go deeper? Pair this metric with tools like heatmaps. They’ll show you where users are spending their time—whether they’re glued to your product descriptions or getting stuck halfway through your FAQ.
4. Click-through rate (CTR)
You’ve got visitors, and they’re spending time on your site. But are they taking action? Are they clicking your call-to-action (CTA) buttons, links, or banners? That’s where click-through rate (CTR) comes in.
CTR measures the percentage of users who click on a specific element compared to the total number of impressions. It’s especially useful for testing CTAs.
Take HubSpot, for example. When they A/B tested the color of their CTA button, they found that a red button outperformed a green one by 21% in CTR. On the surface, that seems like a small tweak. But when you’re running hundreds of campaigns, small improvements like this add up.
The formula:
CTR = (Clicks ÷ Impressions) × 100
Here’s another pro tip: Personalization works wonders. Studies show that personalized CTAs perform 202% better than generic ones. So, instead of “Sign Up,” try “Join 10,000+ Marketers Today.” Also, you could try experimenting with different CTA placements, colours, and copy.
5. Abandonment rate
Picture this: a user adds a product to their cart, clicks “Checkout,” and then… nothing. They leave. No purchase, no follow-up, just a lingering sense of what-could-have-been. That’s the pain of abandonment rate, and it’s one of the most frustrating metrics to track.
Abandonment rate measures the percentage of users who start a process (like filling out a form or beginning checkout) but don’t complete it.
I remember when I carried out a purchase on a notable ecommerce platform some years back. For some reason which I believe came down to the shipping process, I abandoned the purchase midway through checkout. The next time I visited the platform, something felt different about the checkout process—and that’s when it hit me. They had been subtly tweaking their checkout flow based on user behavior like mine.
You see, they had noticed a pattern where users were dropping off at the shipping information page. Through careful A/B testing, they discovered several friction points: the form was too long, shipping costs were revealed too late in the process, and users weren’t given enough shipping options upfront.
The fascinating part was how they handled users like me who had abandoned carts. They used that data to create targeted email follow-ups with personalized shipping offers, which proved to be another successful strategy they discovered through A/B testing.
That’s what A/B testing does for you.
The formula:
Abandonment rate = (Tasks started – Tasks completed) ÷ Tasks started) × 100
The final pro tip: Simplify your process. Fewer steps, fewer distractions, and fewer reasons for users to second-guess themselves.

Tying it all together
A/B testing isn’t just about identifying what works. It’s about understanding why users behave the way they do—and using that insight to create experiences they love. It’s a behavioral analysis.
To recap:
- Conversion rate tells you which version drives results.
- Bounce rate reveals whether users are sticking around.
- Average session duration shows how engaged they are.
- CTR measures intent—are they clicking where you want them to?
- Abandonment rate pinpoints where you’re losing them.
Each of these metrics is a puzzle piece. And together, they create a clear picture of what’s working—and what’s not.
Remember, A/B testing is a continuous process. Even the biggest brands in the world are constantly testing, tweaking, and learning. The good news? You don’t need a massive budget to do the same. Start small. Test one element at a time. And most importantly, focus on the metrics that matter.
Because when you track the right numbers, every test becomes an opportunity—not just for better conversions, but for a better understanding of your users.