A/B testing is one of the most reliable ways to optimize your website, app, or product. It allows you to test two variations and identify which one performs better with your audience. But running a test is only half the battle. The real question is: can you trust the results?
This is where statistical significance comes in. It determines if your test results are real or just random noise. Without it, you’re essentially guessing. Even if one version outperforms the other, there’s no guarantee the results are meaningful unless they’re statistically significant.
In other words, it’s essentially your “confidence level” that the data from your test isn’t just a fluke. It’s the difference between relying on a hunch and knowing your results are backed by math. And while tools like Google Optimize or Optimizely will often display whether your results are statistically significant, understanding what that really means (and whether you can trust it) is crucial.
So, what does “statistical significance” even mean?
Before we dive into the calculations, tools, and other nitty-gritties, let’s take a moment to clarify what statistical significance actually is. According to Optimizely, a leader in A/B testing, “Statistical significance is the likelihood that the difference in conversion rates between a given variation and the baseline is not due to random chance.”
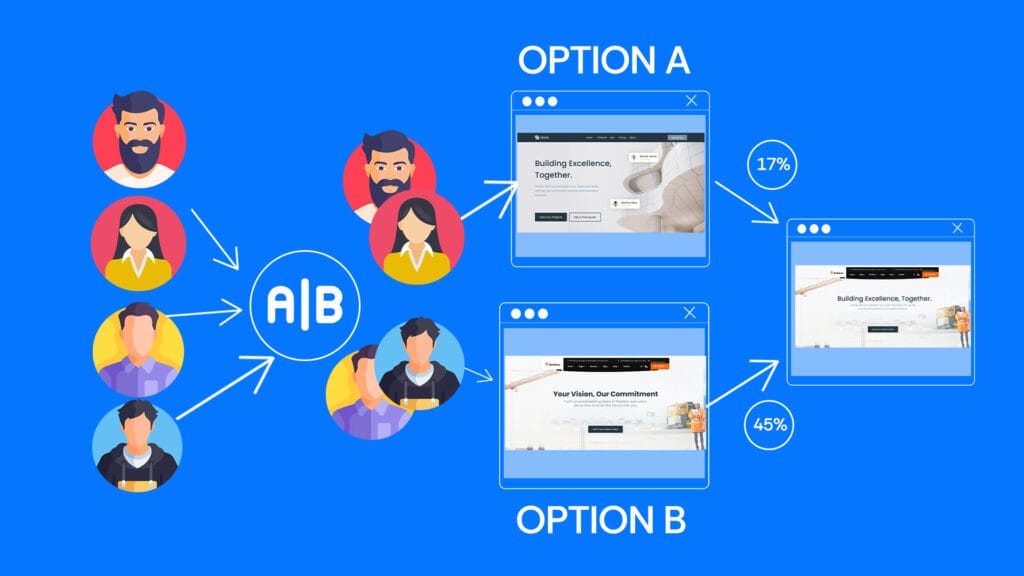
In simpler terms, it’s your way of knowing whether the results from your A/B test are real or just a fluke. Let’s say you’re testing two versions of a landing page—Version A and Version B. Version B gets more sign-ups than Version A. That’s great! But unless your results are statistically significant, you can’t be confident that Version B is truly better. Maybe you just happened to run the test on a day when more people were in the mood to sign up. Statistical significance ensures you’re making decisions based on reliable data, not random noise.
For most A/B tests, a 95% confidence level is the gold standard. This means there’s only a 5% chance that your results are wrong.
Think of it like flipping a coin. If you flip it once and it lands on heads once, you wouldn’t immediately assume the coin is rigged—it’s just a small sample size, and random chance can lead to weird results. But if you flipped it 30 times and it landed on heads 28 times, you’d start to trust that there’s something unusual about that coin. That’s the power of a larger sample size: it helps you distinguish between random noise and meaningful patterns.
Take Google as an example. Back in 2009, Google famously tested 41 shades of blue to determine which one users were most likely to click on. This wasn’t a whimsical experiment; it was grounded in rigorous statistical analysis. By identifying the shade that performed best, Google reportedly added $200 million to its annual revenue. Imagine if they had chosen a shade based on incomplete or insignificant data. That would have left a whole lot of money on the table.
Factors that influence how statistically significant your results will be
Understanding what affects A/B test statistical significance can help you design better experiments and get more reliable results. And while most modern A/B testing tools have features that calculate statistical significance for you. Nonetheless, it’s still important to understand the factors that influence it. Here are a number of them:
1. Sample size
Several key factors determine A/B test statistical significance, with sample size being one of the most crucial elements. The larger your sample size (i.e., the number of people who see each version of your test), the more reliable your results. Think of it like the coin flipping analogy we talked about earlier, except this time, it’s a thousand times more.
If your website has low traffic, reaching a large enough sample size might take weeks or even months. This is why many companies with smaller audiences focus their tests on high-impact areas of their site, like the homepage or checkout page, where changes are more likely to yield noticeable results.
2. Effect size
Effect size refers to the difference in performance between your two variations. If the difference is big—say, Version B increases conversions by 20% compared to Version A—you won’t need as large a sample size to detect it. But if the difference is small (e.g., a 1% lift), you’ll need a much larger sample size to confirm that the result is real and not just random chance.
For example, Booking.com runs thousands of A/B tests every year, but they don’t just test minor tweaks. They focus on big, meaningful changes—like altering the way prices are displayed or introducing new features—because these are more likely to produce significant results.
3. Test duration
A/B tests require enough time to account for natural fluctuations in user behavior. For instance, people might behave differently on weekdays versus weekends. To get a complete picture, most experts recommend running tests for at least two business cycles (typically two weeks). Ending a test too early, even if one variation seems to be “winning,” can lead to misleading results.
Let’s put this into context with an example from Airbnb. Back in the early days, Airbnb conducted an A/B test to see if professional photography of rental listings would increase bookings. They hypothesized that high-quality images would make properties more appealing.
The test involved two groups: one saw listings with professional photos, and the other saw standard amateur photos. Over time, the results showed a substantial increase in bookings for the professionally photographed listings. But here’s the catch: the team didn’t jump to conclusions after just a few days of data.
Instead, they waited until they had a large enough sample size and ran the test long enough to account for fluctuations in booking behavior (seasonality, weekdays vs. weekends, etc.). Once their results hit statistical significance, they rolled out professional photography as a service for hosts—and it became a game-changer for the platform.
The takeaway? Patience and proper data analysis pay off.
How to calculate statistical significance
Now that we’ve established what an A/B test statistical significance is, its importance, and the various factors that tend to influence the statistical significance of your results, how do you go about calculating it? Here’s the basic formula (don’t worry, no calculus required):
Statistical significance is determined by the p-value, which measures the probability that your results are due to chance. The smaller the p-value, the more confident you can be in your results. A p-value of 0.05 (or 5%) is typically the threshold for statistical significance, meaning you’re 95% sure your results aren’t random.
If math isn’t your thing, tools like AB Test Guide or CXL’s test significance calculator can do the heavy lifting for you. Just plug in your data—like the number of users in each group and their conversion rates—and you’ll get an answer in seconds.
What if your results aren’t statistically significant?
It happens more often than you might think. Let’s say you’ve been running a test for two weeks, and the results are inconclusive. What now? Don’t panic—this doesn’t mean the test was a failure. Here’s what you can do:
1. Run the test longer
If your sample size isn’t large enough, extending the test duration might give you the data you need. But be careful not to run the test indefinitely—external factors (like a holiday sale or a sudden spike in traffic) can skew results over time.
2. Segment your data
Sometimes, overall results may not be significant, but specific segments of your audience might respond differently. For example, you might find that mobile users preferred Version B, while desktop users showed no preference. Tools like Google Analytics can help you dig deeper into your data.
3. Reevaluate your hypothesis
If your test didn’t produce significant results, it might be because the change you tested wasn’t impactful enough. Instead of testing a small copy change, try something bolder—like redesigning the layout or introducing a new feature.
To conclude, A/B testing remains one of the most powerful tools in your optimization toolbox as a business owner, product manager, or marketer—but only if you interpret the results correctly. Whether you’re optimizing a landing page or testing new features, confirming A/B test statistical significance ensures your changes are backed by reliable data rather than coincidence, gut feeling or a random coin flip.
Remember the lessons from Airbnb the next time you run a test, double-check your sample size, and let the test run its course. Because when it comes to making data-driven decisions, patience and precision are the keys to success.